|
Lying with
Statistics:
AKA Data Analysis
Gone Wrong

Let's start with
this example: Maybe you saw the
following (it was all over the internet in August 2013)
And now it's global COOLING! Record
return of Arctic ice cap as it grows by 60% in a year.Almost
a million more square miles of ocean covered with ice than
in 2012
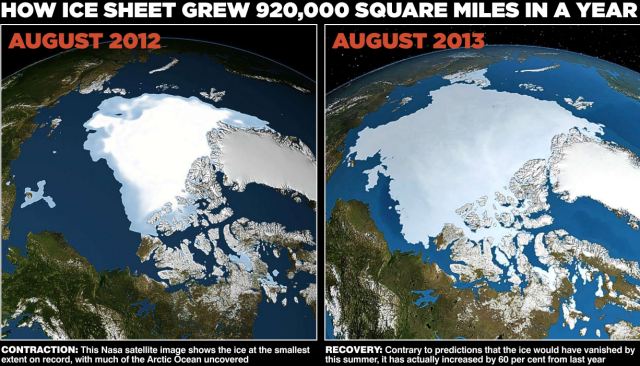
WOW, RIGHT?

First, this statistic is
correct. The Arctic ice cap did grow 60%, which was indeed
almost a million square miles. But this says NOTHING about
possible global cooling, AND it conveys the wrong impression.
Here's why:
1. This is "Cherry Picked"
data. What they did was take the measure of the ice cap at
a specific point in time, namely that point in time when it had
reached it's highest level.
2. They left out the fact
that the ice cap melts and refreezes each year. So, of
course, climatologists would expect it to increase. The
question is not how much it increased but how much it increased
in comparison to other years. It didn't increase as much
in 2012 as it did in 2013, but that does not mean it is NOT
smaller than it used to be. Here is the appropriate
comparison graph that makes this point:
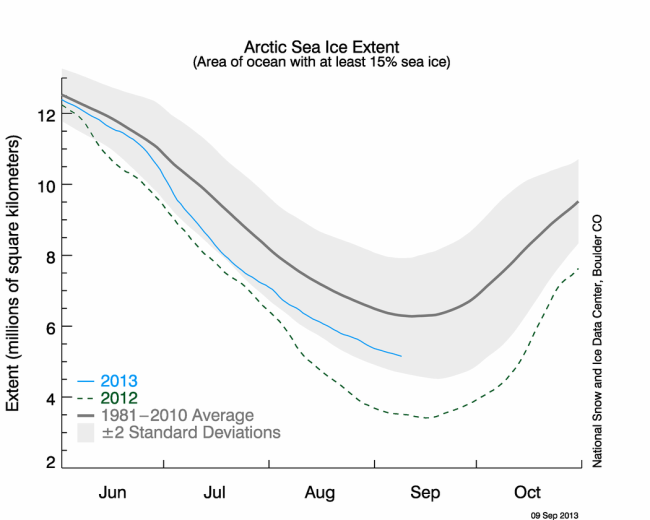
From this you
can see that, while the ice cap became smaller in 2012 than in
2013, in 2013 it is still a good bit smaller than it has been on average
for the past 31 years. Some might say that this does
support the notion of polar ice melt due to global warming, but
NO ONE (except someone wanting to mislead, perhaps even lie
using statistics) can say it supports the notion of global
cooling.
3. Always
question data provided in percentages. The quickest way we
can explain this is with the following example:
Imagine you have a 10 pound
bag of sand.
You pour out 5 pounds (half)
thereby reducing the bag's weight by 50%
You increase the bag's weight
by 50% (half of 5 pounds is 2.5 pounds, so that's how much sand
you put back in), bringing the bag's weight up to 7.5 pounds.
The point: Even though you
decreased the weight of the bag by 50%, then increased the
weight of the bag by 50%, it is still 25% lighter than its
heaviest weight.

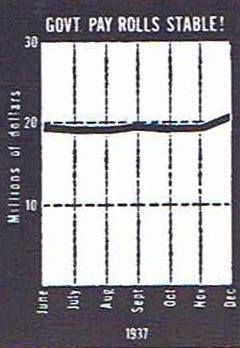
Here's another example of misleading data presentation (taken from 1937 data).
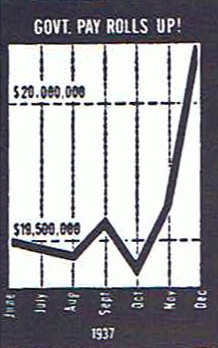
Hmmm, looks
like a sudden and VERY BIG increase in government pay roll,
right?

The graph
above is actually accurate, as is the one below, BUT it doesn't
have a zero point.
Here's what
it looks like with a zero point:
Another example of the above:
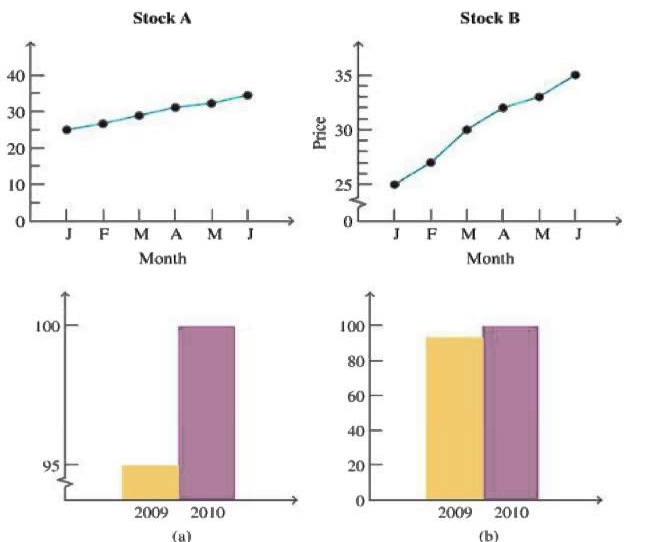
So if you were investing in
the stock market, which of these two stocks would you buy, stock
A or stock B?
Well, as you no doubt have
guessed, they're both the same stock. The graph for Stock
"A" has no zero point.
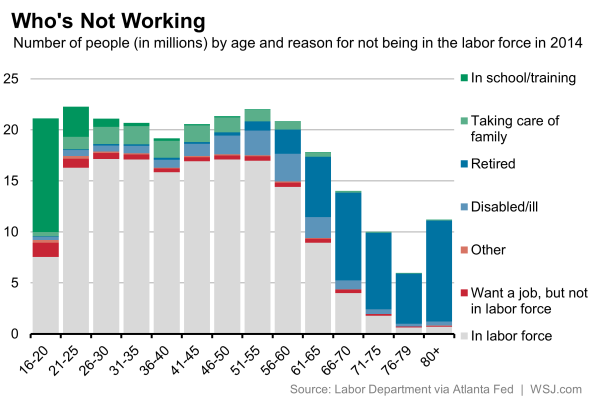
Yet another example: How many people are
unemployed? 95 million?
Have you seen the various
numbers that have been bandied about on the internet? The
highest we've seen (as of December 2016) is about 95 million.
While this total is based on actual, verifiable data from the
Bureau of Labor Statistics (BLS) it is misleading (which is why
we've included it on our Lying with Statistics page).
So here's the deal, while
population data shows that around 95 million are not employed,
that number includes lots of people who likely aren’t looking
for work. It includes every American of retirement age -- 65 and
older. It includes every high-school student at least 16 years
of age. It includes every college and many graduate or
professional-school students currently enrolled and in classes.
It includes every person who has a disability that makes it
impossible for them to work. It includes parents who are
choosing to stay home to take care of their kids. It includes
every adult who’s gone back to school full-time. It even
includes trust-fund kids who are living off investments. While the following is from 2014, here's
a graph that shows
A final (for now) example (using made up names):
Perhaps
you've seen ads on TV telling how online dating
service "Meet Your Mate" has the most dates and marriages.
So, okay,
let's say that this is true. "Meet Your Mate" does
indeed have the most dates
and marriages of ALL online dating services.
But what they
left out is the fact that it is also the OLDEST such online
service, having been online twice as long as any other such
service. So OF COURSE it has the MOST in all categories.
What's wrong?
The RATE is more important than the total. What matters
his how many out of those who visit the site. In our
hypothetical example, it turns out that "Find Your Partner" has
a much higher rate of dates and marriages than "Meet Your
Mate," because one out of ten make dates and one out of a
hundred get married, compared to one out of fifteen and one out
of one hundred and fifty for "Meet Your Mate."
No
doubt you've heard it said, "Statistics don't lie. People
lie using statistics." That's what we're going to explore
here: Just how does this occur?
 We
think
that sometimes it's by accident, but sometimes it's on purpose. We
think
that sometimes it's by accident, but sometimes it's on purpose.
So we want to examine the ways to
tell whether data collection, reporting and analysis
can be valid, or invalid (i.e., legit, or not legit).
1. The primary tool for all
reality checking is critical thinking. It is so important
that we've devoted a whole article to it. So we're not
going to repeat it here. We're just going to tell you to
use it.
2. Always check to see
how much detail is provided, especially in terms of size of
samples and the breakdown (subsamples). For example,
saying that a survey shows 50% of the public approve, or
disapprove something is nearly useless. We need to know
who was asked (e.g., ages, ethnic background, etc.), how many
were asked (sample size), and what the actual questions were
asked. All these details can make a tremendous difference
in what the data means.
3. Remember that the
data (or statistics) may be valid, but if they are
cherry-picked, they can be useless.
4. Remember that even
if every aspect of the research methodology and data reporting
is valid, the interpretation of the conclusions are always
theoretical and thus debatable. Try to think of alternate
conclusions that might be drawn from the date.
5. Do a search to see
if there are alternate analyses and conclusions and apply
critical thinking to them as well.
6. Finally, if you know
anything about research methodology and the rules for validity,
apply them. If not, you can check for them online.
 To
read about critical thinking.
To
read about critical thinking.
To
see an online search concerning research methodology (will open
in new tab, or window)
To
go to the brief introduction to intentional efforts to obstruct, or avoid reality
To
go to the Articles Page
All written text on this website copyright
© Reality Check Online
|