 Unemployment:
What it is and isn't
Unemployment:
What it is and isn't
What with all the concern
about economic recovery from the Great Recession of December
2007 to February 2008 (when about 8.7 million jobs were lost and
the GDP contracted by 5.1%), there has been considerable and
very understandable concern about the degree to which things
have improved since then.
Unfortunately, in the process
there have been many distortions and misinformation concerning
unemployment figures, which we
propose to expose and explain.
How many people are
unemployed? 95 million?
Have you seen the various
numbers that have been bandied about on the internet? The
highest we've seen (as of December 2016) is about 95 million.
While this total is based on actual, verifiable data from the
Bureau of Labor Statistics (BLS) it is misleading (which is why
we've included it on our Lying with Statistics page).
So here's the deal, while
population data shows that around 95 million are not employed,
that number includes lots of people who likely aren’t looking
for work. It includes every American of retirement age -- 65 and
older. It includes every high-school student at least 16 years
of age. It includes every college and many graduate or
professional-school students currently enrolled and in classes.
It includes every person who has a disability that makes it
impossible for them to work. It includes parents who are
choosing to stay home to take care of their kids. It includes
every adult who’s gone back to school full-time. It even
includes trust-fund kids who are living off investments.
Of the number of
Americans age 16 and up who are deemed "not in the labor force"
(this is the data being used), 9.7 million of them are between
16 and 19 years of age. Another 5.7 million are between 20 and
24. And 37.8 million are age 65 and over. (In fact, 17.5 million
are over 75 years old.)
Get the picture? When
it comes to the actual number of people (not the percentage, or
unemployment rate) who could work and maybe want to work, it's a
lot less (more than half less) than the 95 million being cited
(again, early December 2016)
So what's the best way to
view this? While the following is from 2014, here's
a graph that shows
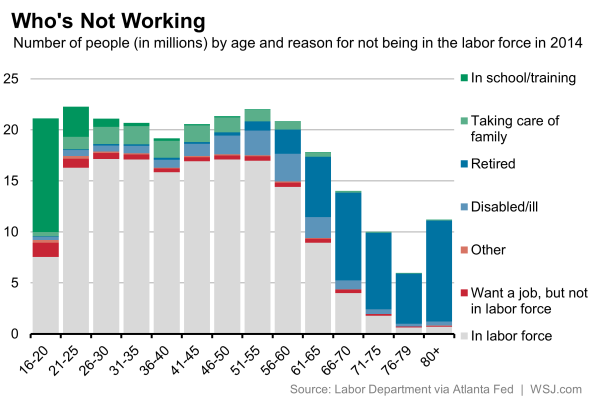
This graph provides a visual
breakdown to help see how the total number not in the labor
force does not accurately represent those who could work but are
unemployed. About 41 million Americans don’t work because
they’re retired. These retirees are overwhelmingly actually of
retirement age. It makes no sense to say they are "unemployed."
On top of that, an additional 15 million say they’re not in the
labor force because they’re in school. Some students, of course,
work while they’re in school.
From what we've seen on the
internet, most of those who cite the 95 million are trying to
discredit the unemployment rate that is released by the BLS,
usually in order to claim some sort of false reporting and/or
point out the failure of the president in office at the time.
As you now know, this is a form of misleading, if not lying with
statistics.
 To see our Lying with Statistics page
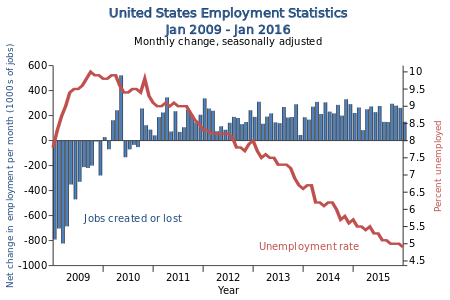
Unemployment rate:
Presented as a percentage of the
labor pool, this is the number most often provided by the BLS. As
of the end of 2015, this is how it has changed over the past 7 years
(since the Great Recession)
Calculating the
unemployment rate:
Unemployment rate is the percentage
of labor force that is currently unemployed but was available for job in
last four weeks and was actively seeking employment in that period. It
is the ratio of the number of unemployed people to the sum of the number
of employed and unemployed people.
It is arguably the single most important economic statistic. The closer
the rate is to the natural rate of unemployment, the healthier the
economy is. An unemployment rate significantly higher than the natural
rate of unemployment means that the economy is in recession.
According to the definition of the
Bureau of Labor Statistics (BLS), employed persons are persons who are:
Aged 16 or older,
Work for an employer or are self-employed,
Not volunteers, and
Not engaged in self-service such as homemaking, etc.
Unemployed persons are persons who:
Are aged 16 year or older,
Are not engaged in any employment (self or otherwise),
Were available for job in last four weeks, and
Have made specific efforts to find a job at any time during last four
weeks.
Formula: Unemployment Rate =
Unemployed
Employed+ Unemployed
How valid is the
unemployment rate provided by the BLS?
Given the definition used (see above), it
is totally valid. But the BLS has developed alternate
measures, as shown below.
Table A-15. Alternative measures of labor underutilization
|
HOUSEHOLD DATA
Table A-15. Alternative measures
of labor underutilization
[Percent] |
|
|
Measure |
Not
seasonally adjusted |
Seasonally adjusted |
|
|
Nov.
2015 |
Oct.
2016 |
Nov.
2016 |
Nov.
2015 |
July
2016 |
Aug.
2016 |
Sept.
2016 |
Oct.
2016 |
Nov.
2016 |
|
|
U-1 Persons
unemployed 15 weeks or longer, as a percent of the civilian
labor force |
2.1 |
1.9 |
1.8 |
2.1 |
2.0 |
1.9 |
2.0 |
2.0 |
1.8 |
|
|
U-2 Job
losers and persons who completed temporary jobs, as a percent of
the civilian labor force |
2.3 |
2.1 |
2.1 |
2.5 |
2.3 |
2.4 |
2.5 |
2.3 |
2.2 |
|
|
U-3 Total
unemployed, as a percent of the civilian labor force (official
unemployment rate) |
4.8 |
4.7 |
4.4 |
5.0 |
4.9 |
4.9 |
5.0 |
4.9 |
4.6 |
|
|
U-4 Total
unemployed plus discouraged workers, as a percent of the
civilian labor force plus discouraged workers |
5.2 |
5.0 |
4.8 |
5.4 |
5.2 |
5.3 |
5.3 |
5.2 |
5.0 |
|
|
U-5 Total
unemployed, plus discouraged workers, plus all other persons
marginally attached to the labor force, as a percent of the
civilian labor force plus all persons marginally attached to the
labor force |
5.8 |
5.7 |
5.6 |
6.1 |
6.0 |
5.9 |
6.0 |
5.9 |
5.8 |
|
|
U-6 Total
unemployed, plus all persons marginally attached to the labor
force, plus total employed part time for economic reasons, as a
percent of the civilian labor force plus all persons marginally
attached to the labor force |
9.6 |
9.2 |
9.0 |
9.9 |
9.7 |
9.7 |
9.7 |
9.5 |
9.3 |
|
|
NOTE: Persons marginally attached
to the labor force are those who currently are neither working
nor looking for work but indicate that they want and are
available for a job and have looked for work sometime in the
past 12 months. Discouraged workers, a subset of the marginally
attached, have given a job-market related reason for not
currently looking for work. Persons employed part time for
economic reasons are those who want and are available for
full-time work but have had to settle for a part-time schedule.
Updated population controls are introduced annually with the
release of January data. |
|
To
go to the brief introduction to Hot Topics
To
go to the brief introduction to money matters
To
go to the Articles Page